Posts Tagged ‘Analysights’

“Big Data” Success Starts With Good Data Governance

May 19, 2014

(This post appeared on our successor blog, The Analysights Data Mine, on Friday, May 9, 2014). 

As data continues to proliferate unabated in organizations, coming in faster and from more sources each day, decision makers find themselves perplexed.  Decision makers struggle with several questions: How much data do we have? How fast is it coming in? Where is it coming from? What form does it take? How reliable is it? Is it correct? How long will it be useful?  And this is before they even decide what they can and will do with the data!

Before a company can leverage big data successfully, it must decide upon its objectives and balance that against the data it has, regulations for the use of that data, and the information needs of all its functional areas. And it must assess the risks both to the security of the data and to the company’s viability.  That is, the company must establish effective data governance.

What is Data Governance?

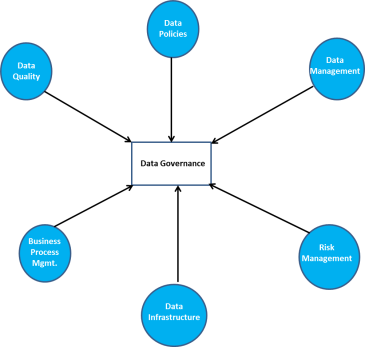
Data governance is a young and still evolving system of practices designed to help organizations ensure that their data is managed properly and in the best interest of the organization and its stakeholders.  Data governance is an organization’s process for handling data by leveraging its data infrastructure, the quality and management of its data, its policies for using its data, its business process needs, and its risk management needs.  An illustration of data governance is shown below:

governance

Why Data Governance?

Data has many uses; comes in many different forms; takes up a lot of space; can be siloed, subject to certain regulations, off-limits to some parties but free and unlimited to others; and must be validated and safeguarded.  But just as much, data governance ensures that the business is using its data toward solving its defined business problems.

The explosion of regulations, such as Sarbanes-Oxley, Basel I, Basel II, Dodd-Frank, HIPAA, and a series of other rules regarding data privacy and security are making the role of data governance all the more important.

Moreover, data comes in many different forms. Companies get sales data from the field, or from a store location; they get information about their employees from job applications. Data of this nature is often structured.  Companies also get data from their web logs, from social media such as Facebook and Twitter; they also get data in the form of images, text, and so forth; these data are unstructured, but must be managed regardless.  Through data governance, the company can decide what data to store and whether it has the infrastructure in place to store it.

The 6 Vs of Big Data

Many people aware of big data are familiar with its proverbial “3 Vs” – Volume, Variety, and Velocity.  But Kevin Normandeau, in a post for Inside Big Data, suggests that three more Vs pose even greater issues: Veracity (cleanliness of the data), Validity (correctness and accuracy of the data), and Volatility (how long the data remains valid and should be stored).  These additional Vs make data governance an even greater necessity.

What Does Effective Data Governance Look Like?

Effective data governance begins with designation of an owner for the governance effort – an individual or team who will be held accountable.

The person or team owning the data governance function must be able to communicate with all department heads to understand the data they have access to, what they use it for, where they store it, and what they need it for.  They must also be adroit in their ability to work with third party vendors and external customers of their data.

The data governance team must understand both internal policies and external regulations governing the use of data and what specific data is subject to specific regulations and/or policies.

The data governance team must also assess the value of the data the company collects; estimate the risks involved if a company makes decisions based on invalid or incomplete data, or if the data infrastructure fails, or is hacked; and design systems to minimize these risks.

The team must then be able to draft, document, implement, and enforce its governance processes once data has been inventoried and matched to its relevant constraints, and the team develops its processes for data collection and storage.  The team must then be able to train employees of the organization in the proper use and collection of the data, so that they know what they can and cannot do.

Without effective data governance, companies will find themselves vulnerable to hackers, fines, or other business interruptions; they will be less efficient as inaccurate data will lead to rework and inadequate data will lead to slower, less effective decision making; and they will be less profitable as lost data or incomplete data will often cause them to miss opportunities or take incorrect actions due to decisions on such data.  Good data governance will ensure that companies get the most out of their data.


****************************************************

Follow Analysights on Facebook and Twitter!

Now you can find out about new posts to both Insight Central and our successor blog, The Analysights Data Mine, by “Liking” us on Facebook (just look for Analysights), or by following @Analysights on Twitter.  Each time a new post appears on Insight Central or The Analysights Data Mine, you will be notified by either your Facebook Newsfeed or your Twitter feeds.  Thanks!
 

Check out the Analysights Data Mine

March 26, 2014

As many of you have seen, the last post on Insight Central was in April 2011. I just wanted to take this moment and let you know that I have christened a brand new blog this morning, the Analysights Data Mine, which discusses trends and developments in the field of “Big Data.” If you love Insight Central, you’ll also love the Data Mine. Insight Central will remain up for your enjoyment, although I have no further plans to post on it. Thanks for your visits and loyalty to Insight Central; I look forward to seeing you again on the Data Mine.

Forecast Friday Topic: Evaluation of Forecasts

April 14, 2011

(Last in the series)

We have finally come to the end of our almost year-long Forecast Friday journey. During this period, we have discussed various forecasting methods, including regression analysis, exponential smoothing, moving average methods, the basics of both ARIMA and logistic regression models. We also discussed qualitative, or judgmental, forecasting methods; we discussed how to diagnose your regression models for violations such as multicollinearity, autocorrelation, heteroscedasticity, and specification bias; and we discussed a series of other topics in forecasting, like the identification problem, leading economic indicators, calendar effects in forecasting, and the combination of forecasts. Now, we move on to the last part of the forecasting process: evaluating forecasts.

How well does your forecast model perform? That question should be the crux of your evaluation. This criterion relates to your company’s bottom line. You need to consider the costs to your company of forecasting too high and of forecasting too low. If you own a toy store and your sales forecasts for some stock-keeping units (SKUs) is too high, you risk marking down those items on clearance. On the other hand, if your forecast is too low, you risk running out of stock. Which type of mistake is more costly to your company? How much error in each direction can you tolerate, affordably? These are questions you must consider.

Your models are useless if you don’t track how well they perform. Any time you generate a forecast, your model will not only give you a point forecast, but also a prediction interval associated with a given level of confidence. The point forecast is the midpoint of that prediction interval. Each time you generate a forecast, record the actual results. Did actuals fall within the prediction interval? If so, how close to the point forecast did they fall? If not, how far off were you?

As you keep track forecasts vs. actuals over time, determine how often your actuals fall within our outside your prediction intervals, and how close to the point forecast they are. If your forecasts are frequently far from your point estimate, especially near the upper or lower bounds of your prediction interval, that’s likely a sign that your model needs to be reworked. Indeed, model performance degrades over time. Technological advances, societal changes, changes in tastes, styles, and preferences, and random events can promote forecast error, because forecasting models are based on past data and assume that the future will continue to resemble the past.

Forecasting is as much an art as it is a science. And I hasten to add that the ability to forecast is like a muscle – you need to exercise it in order to strengthen it. Forecasts are never consistently perfect, but they can be frequently excellent. Don’t look to become a forecasting “guru.” It doesn’t last. Allow yourself to learn new things from every forecasting process you go through and each forecast evaluation you perform. And if you do that, becoming a great forecaster is in your forecast! And I can’t think of a better note on which to end the Forecast Friday series.

**********

Tell us what you thought of the Forecast Friday series!

We’ve been on a long road with Forecast Friday. I began the series last year because I believed that forecasting is an art that every business entity, or marketing, finance, production (etc.) professional could use to go far. Many of you have been tuning in to Forecast Friday each Thursday, so I would appreciate your honest feedback. Please leave comments. Let me know the topic(s) you found most helpful or useful. What could I have done better? What topic(s) should I have covered? Please don’t hold back. The purpose of Insight Central and Forecast Friday is to help you use analytics to advance your business and/or career.

Forecast Friday Topic: Does Combining Forecasts Work?

March 31, 2011

(Forty-second in a series)

Last week, we discussed three approaches to combining forecasts: a simple average, assigning weights inversely proportional to sum of squared error, and regression-based weights. We combine forecasts in order to incorporate the best features of each forecasting method used and to minimize the errors of each. But does combining forecasts work in practice? The literature over the years suggests that it does. Newbold and Bos (1994) summarize the research on the combination of forecasts below:

  1. Regardless of the forecasts combined or individual forecasting methods used in the composite, the combined forecast performs quite well, and is often superior to the individual forecasts;
  2. The simple average approach to combining forecasts performs very well;
  3. The weights inversely proportional to SSE generally performs better than regression-based weights, unless there’s just a small number of forecasts to be combined and some forecasts are much superior to others. In situations like those, regression-based combining methods tend to work better than simple averages and weights inversely proportional to SSE, or the worst forecasts are excluded from the composite.

Why does the combination of forecasts work? Makridakis, Wheelwright, and Hyndman (1998) provide four reasons. Generally, many forecasts can’t measure the very thing they desire. For example, it’s very hard to measure demand for a product or service, so companies measure billings, orders, etc., as proxies for demand. Because the use of proxies can introduce bias in forecasts, the combination of forecasts can reduce the impact of these biases. Secondly, errors in forecasting are inevitable, and some forecasts have errors that are much greater than others. Combining the forecasts can smooth out the forecast error. Moreover, time series can have patterns or relationships that are unstable or frequently changing. By combining forecasts, we can reduce the errors brought on by random events in forecasting. Finally, most forecasting models minimize the forecast errors for one-period ahead. Forecasts are often necessary for several periods ahead; yet the further into the future we aim to predict, the less accurate our forecasts. Combining forecasts helps to minimize the error of forecasts several periods ahead.

Whenever and wherever possible, organizations should try to generate forecasts via many different approaches and then derive a composite forecast. Different approaches touch on different functions within the organization and increase the representativeness of the real world factors under which it operates. When those factors are accounted for in the composite forecast, accurate predictions frequently emerge.

Next Forecast Friday Topic: Evaluating Forecasts – Part I

Next week, we will begin the first of two-part discussion on the evaluation of forecasts. Once we generate forecasts, we must evaluate them periodically. Model performance degrades over time and we must see how our models are performing and tweak or alter them, or remodel all together.

********************************************************

Follow us on Facebook and Twitter!

For the latest insights on marketing research, predictive modeling, and forecasting, be sure to check out Analysights on Facebook and Twitter! “Like-ing” us on Facebook and following us on Twitter will allow you to stay informed of each new Insight Central post published, new information about analytics, discussions Analysights will be hosting, and other opportunities for feedback. So check us out on Facebook and Twitter!

Forecast Friday Topic: Procedures for Combining Forecasts

March 24, 2011

(Forty-first in a series)

We have gone through a series of different forecasting approaches over the last several months. Many times, companies will have multiple forecasts generated for the same item, usually generated by different people across the enterprise, often using different methodologies, assumptions, and data collection processes, and typically for different business problems. Rarely is one forecasting method or forecast superior to another, especially over time. Hence, many companies will opt to combine the forecasts they generate into a composite forecast.

Considerable empirical evidence suggests that combining forecasts works very well in practice. If all the forecasts generated by the alternative approaches are unbiased, then that lack of bias carries over into the composite forecast, a desirable outcome to have.

Two common procedures for combining forecasts include simple averaging and assigning weights inversely proportional to the sum of squares error. We will discuss both procedures in this post.

Simple Average

The quickest, easiest way to combine forecasts is to simply take the forecasts generated by each method and average them. With a simple average, each forecasting method is given equal weight. So, if you are presented with the following five forecasts:

You’ll get the average of $83,000 as your composite forecast.

The simplicity and quickness of this procedure is its main advantage. However, the chief drawback is if information is known that individual methods consistently predict superiorly or inferiorly, that information is disregarded in the combination. Moreover, look at the wide variation in the forecasts above. The forecasts range from $50,000 to $120,000. Clearly, one or more of these methods’ forecasts will be way off. While the combination of forecasts can dampen the impact of forecast error, the outliers can easily skew the composite forecast. If you suspect one or more forecasts may be inferior to the others, you may just choose to exclude them and apply simple averaging to the forecasts for which you have some reasonable degree of confidence.

Assigning Weights in (Inverse) Proportion to Sum of Squared Errors

If you know the past performance of individual forecasting methods available to you, and you need to combine multiple forecasts, it’s likely you will want to assign greater weights to those forecast methods that have performed best. You will also want to allow the weighting scheme to adapt over time, since the relative performance of forecasting methods can change. One way to do that would be to assign weights to each forecast in based on their inverse proportion to the sum of squared forecast errors.

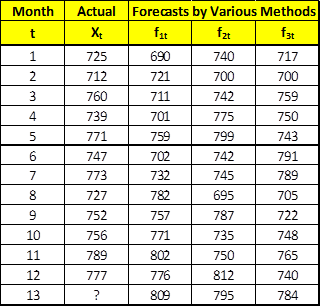
Let’s assume you have 12 months of sales data, actual (Xt), and three forecasting methods, each generating a forecast for each month (f1t, f2t, and f2t). Each of those three methods have also generated forecasts for month 13, which you are trying to predict. The table below shows these 12 months of actuals and forecasts, along with each method’s forecasts for month 13:

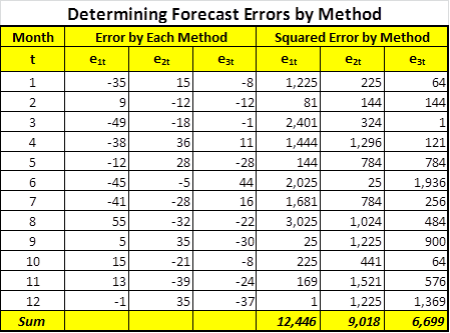
How much weight do you give each forecast? Calculate the sum squared error for each:

To get the weight of the one forecast method, you need to divide the sum of the other two methods’ squared errors by the total sum of the squared errors for all three methods, and then divide by 2 (3 methods minus 1). You must then do the same for the other two methods, in order to get the weights to sum to 1. Hence, the weights are as follows:


Notice that the higher weights are given to the forecast methods with the lowest sum of squared error. So, since each method generated a forecast for month 13, our composite forecast would be:

Hence, we would estimate approximately 795 as our composite forecast for month 13. When we obtain month 13’s actual sales, we would repeat this process for sum of squared errors from months 1-13 for each individual forecast, reassign the weights, and then apply them to each method’s forecasts for month 14. Also, notice the fraction ½ at the beginning of each weight equation. The denominator depends on the number of weights we are generating. In this case, we are generating three weights, so our denominator is (3-1)=2. If we would have used four methods, each weight equation above would have been one-third; and if we had only two methods, there would be no fraction, because it would be one.

Regression-Based Weights – Another Procedure

Another way to assign weights would be with regression, but that’s beyond the scope of this post. While the weighting approach above is simple, it’s also ad hoc. Regression-based weights can be much more theoretically correct. However, in most cases, you will not have many months of forecasts for estimating regression parameters. Also, you run the risk of autocorrelated errors, most certainly for forecasts beyond one step ahead. More information on regression-based weights can be found in Newbold & Bos, Introductory Business & Economic Forecasting, Second Edition, pp. 504-508.

Next Forecast Friday Topic: Effectiveness of Combining Forecasts

Next week, we’ll take a look at the effectiveness of combining forecasts, with a look at the empirical evidence that has been accumulated.

 ********************************************************

Follow us on Facebook and Twitter!

For the latest insights on marketing research, predictive modeling, and forecasting, be sure to check out Analysights on Facebook and Twitter! “Like-ing” us on Facebook and following us on Twitter will allow you to stay informed of each new Insight Central post published, new information about analytics, discussions Analysights will be hosting, and other opportunities for feedback. So check us out on Facebook and Twitter!